7 Quality Control Tools – Basic Awareness
About Course
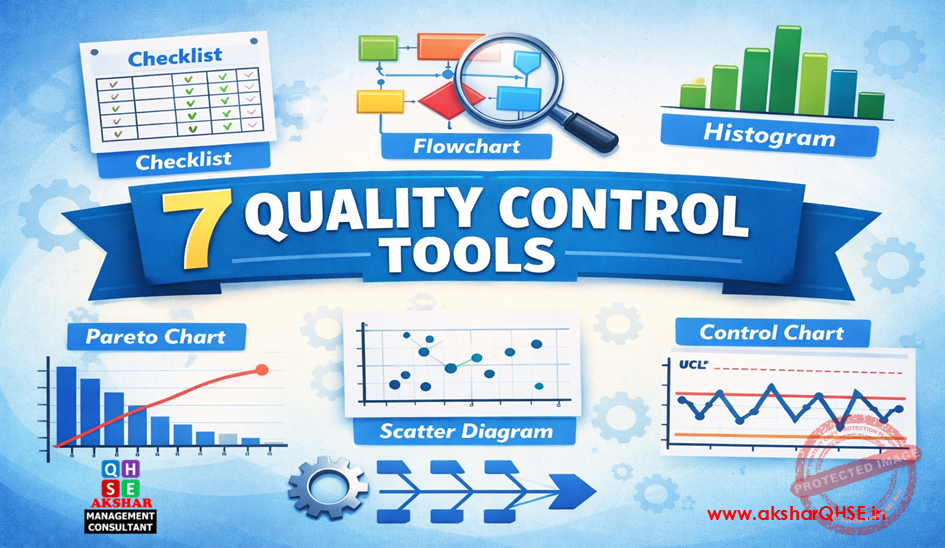
Akshar Management Consultant introduces the training on 7 Quality Control Tools. This training on the 7 Quality Control (QC) Tools provides practical knowledge of essential problem-solving techniques used in quality management. Participants will learn how to collect, analyse, and interpret data using tools like Check Sheets, Pareto Charts, Cause-and-Effect Diagrams, Histograms, Scatter Diagrams, Control Charts, and Stratification to improve processes, reduce defects, and support data-driven decision making.
MUST WATCH SAMPLE VIDEO – PARETO CHART (FREE)
COURSE DURATION
- 8 hours
COURSE ACCESS
- 8 days
- The course must be completed in 8 days.
- It means the effort is less than 1 hour per day.
- Participants may access the course content at any time, any day, during the 8 days.
COURSE OVERVIEW
This training program on the 7 Quality Control (QC) Tools is designed to equip participants with fundamental problem-solving and data analysis techniques used in quality management and process improvement. The course focuses on the practical application of tools such as Check Sheets, Pareto Analysis, Cause-and-Effect Diagrams, Histograms, Scatter Diagrams, Control Charts, and Stratification. Participants will learn how to systematically collect and analyse data, identify root causes of problems, prioritise improvement areas, and make data-driven decisions. The training emphasises real-world examples and hands-on understanding to help improve product quality, reduce defects, and enhance overall operational efficiency. By the end of the course, learners will be able to confidently apply the 7 QC Tools in workplace situations to support continuous improvement initiatives and quality excellence.
COURSE CONTENT
- Introduction to Quality & QC Tools
- Concept of quality
- Importance of data-driven problem solving
- Overview of 7 QC Tools in Continuous Improvement
- Check Sheet
- Purpose and types
- Data collection methods
- Practical exercise for defect tracking
- Real industry examples
- Pareto Chart (80/20 Principle)
- Concept of prioritisation
- How to prepare a Pareto analysis
- Identifying major problem causes
- Real industry examples
- Cause-and-Effect Diagram (Fishbone / Ishikawa)
- Root cause analysis approach
- Categories of causes (Man, Machine, Material, Method, etc.)
- Group activity on problem-solving
- Histogram
- Understanding data distribution
- Frequency and variation analysis
- Interpretation of process performance
- Real industry examples
- Scatter Diagram
- Relationship between two variables
- Correlation analysis (positive, negative, no correlation)
- Practical examples
- Control Charts
- Concept of process control
- Common cause vs special cause variation
- Basic interpretation of control limits
- Flowchart
- Meaning and importance
- Standard shapes
- Examples
WHO SHOULD ATTEND
- Quality Manager/ Engineer
- Environment Engineer/ Manager
- Safety Officer/ Manager
- Management Representative
- ISO Consultant
- An individual responsible for the implementation of the ISO system
- An individual interested in pursuing a career in IMS auditing
- Internal Auditors
CERTIFICATE
- A certificate of successful completion will be issued to participants who complete the entire course, including the final assessment.
TRAINING FACILITATOR
- Akshar Management Consultant
Course Content
Introduction
-
Video
11:57